Create Demand Categories
Demand categories provide a way to organize demand views, which contain demand items that need to be planned. All planners can see demand categories, so you should create a few broad categories that serve most of your planning needs.
- IT Ops Demand
- Product Demand
- Business Demand
- From the Configure menu, select Manage Demand Categories.
- Click + Another category.
- Type a name for the new category.
- After creating categories, drag and drop them to organize them as they will appear in the navigation pane.
Share Pre-configured Demand Views
Demand Center contains pre-configured views for each default category. The views are designed to work with specific process apps, as described below.
| Category | View Name | Process App |
|---|---|---|
| Business | Business Requests | Business Requests |
| Development | Product Themes | Business Requests |
| Operations | Significant RFCs | Change Management |
These views must be shared with users before they are visible to them in Demand Center. As an administrator, you can share the view with users or groups.
To share pre-configured demand views:
- Expand one of the default demand categories, and select one of the views listed above.
- Click the edit icon (
 ).
).
- Select the Sharing tab.
- Search for users and groups to share the view with, and then click Add.
- Save your changes.
Create Plan Portfolios
Plan portfolios provide a way to group plans. This provides visibility into a set of plans, such as those based on particular dates or business unit. All planners see portfolios, so you should name and organize them in a way that makes sense for everyone who will use Demand Center.
- From the Configure menu, select Manage Plan Portfolios.
- Click + Another portfolio.
- Type a name for the new portfolio and repeat as needed.
- After creating portfolios, drag and drop them to organize them as they will appear in the navigation pane.
Review the "My Pending Plans" Report
The Demand Plan process app includes the "My Pending Plans" report, which is used to populate the Pending Plans page on the Plans tab in Demand Center. This report enables Demand Center users to see the plan on this page if they are currently set as a plan owners, submitters, concept approvers, analysts, reviewers, and stakeholders.
The "My Pending Plans" report is set as a guest-level report. All users assigned to any of the default Demand Plan roles are granted privileges to run this plan and to see pending plans returned by the report in Demand Center.
The "My Pending Plans" report can be modified, but changes impact all Demand Center users, so use caution when changing report criteria. In addition, do not change the columns to display or the report name.
Define a Scoring Matrix
You can define scoring criteria used to help planners weigh the benefits and cost of each demand item in a plan. By defining a matrix used by all planners, you can ensure consistency in scoring and help standardize prioritization of demand items.
A default matrix is provided, but you can modify it as needed.
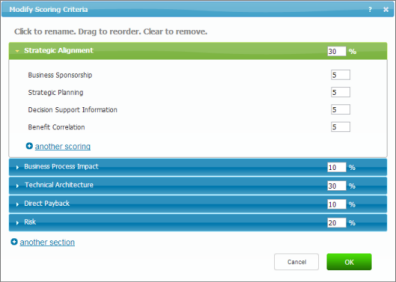
For example, you can create different scoring categories and set a weight percentage for each category. Categories can be weighed differently, such as Strategic Alignment (40 percent), Business Process Impact (25 percent), and Risk (35 percent). In each category, you can add attributes with numeric scores, such as 0 to 5, with 0 interpreted as not set or not applicable and 5 as the highest score.
Scores are calculated based on individual attributes and the category weight percentage. For example, the Strategic Alignment category may include attributes for Executive Sponsorship and Strategic Planning. Each attribute is given a score of 0 to 5. The score for each attribute is summed and divided by the total possible values for each category. This figure is multiplied by the weight percentage for the section and then by 100, resulting in a weighted score for each demand item.
Example:
Business sponsorship (5) + Strategic planning (4) = 9
Total possible score for Strategic Alignment = 10
9 ÷ 10 = .9
.9 × .40 = .36
.36 × 100 = 36
Final scoring value is 36.
- From the Configure menu, select Manage Scorecards.
- Select the name or a scoring category to rename it, or click +another section to add a new category.
- Provide weight percentages for each category. Weights for all categories should total 100 percent.
- In each category, add or rename scoring attributes.
- Add scoring values for each attribute. Ideally, each attribute has the same scoring range, such as 1 to 5.
- Drag and drop categories and attributes to reorder them.
- Save your changes.
The following figure shows an example of a modified scoring matrix.
Sharing the Default Backlog Plan with Users
Demand Center comes with a default backlog that can be shared with all users. This enables your organization to store all backlog items in one place. Users can also create their own backlogs and share them with other users as needed.
Before users can add items to the default backlog, you must share it with them. Users must be assigned to one of the Demand Plan roles before they can share the backlog.
To share the default backlog:
- On the Demand tab, select the Backlog icon located in the Plans pane at the bottom of the page.
- Click the edit icon (
).
- Optionally, rename the backlog.
- Select the Sharing tab.
- Search for users and groups who will add items to the default
backlog, and then add them.
Tip: For best results, add all users and groups who may need access to your default backlog.
- Save your changes.
Customize the Demand Center Shell
You can change the logo and page title for the Demand Center, and also modify the Web page that opens when users click your logo. These changes can be made by any user administrative access and are seen by all Demand Center users.
From the Configure menu, select Demand Center, and then modify the following settings as needed:
- Title
You can change the text that appears to the right of the logo. Use the toolbar to apply formatting.
- Image (URL)
Enter a URL to a logo that is accessible to all Demand Center users. For example, do not enter a logo that is located in a restricted domain that is not accessible by all users.
- Image Link
Enter the URL for a Web page that opens when users click the logo.