Distribution, Duration, and Trend reports can be displayed in a variety of graphical formats, such as bar charts and pie charts.
Depending on your administrative setup, Rich Graphical Reports may be enabled for the SBM User Workspace. These reports offer dynamic charting, animation, and drill-down capabilities. Rich Graphical Reports require the Adobe Flash Player. If the Flash Player is not installed, you are prompted to install it when you run a Rich Graphical Report.
Various options are available for Rich Graphical Reports and you can right-click in the report results to open a menu of these options. For example, you can print your report by selecting Print Chart from the menu.
Note: These features are not available if your administrator
has disabled Rich Graphical Reports for your system, if your system uses a
"modern" theme, or you are using
SBM Work Center.
In these cases, the Adobe Flash Player is not required and your reports have a
different appearance.
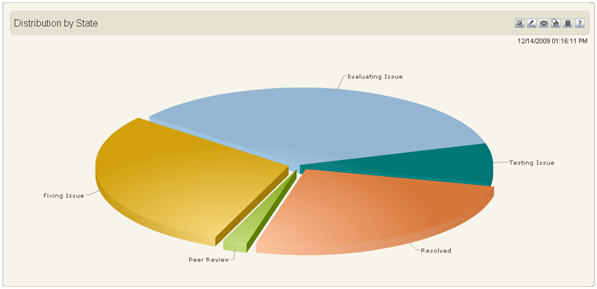
The following figure shows an example of a Rich
Graphical Report. This example is a
Distribution report set to display as a pie chart with
"slicing" enabled.
For details on creating graphical reports, refer to: