Release Control provides several views into your release activities.
These views are available when the Release Ctrl application group is pinned and selected. Views are available to all Release Control users, but privileges determine which data is visible to users in each view.
All views except timelines are implemented using standard Work Center functionality. For information on modifying these, see the Work Center help.
Release Dashboard
The Release Dashboard includes widgets with graphical reports that show the overall health of your release activities. By default, widgets with the following reports are provided:
- Current Overdue Milestones
- Open Exit Criteria
- Release Train Throughput
- Deployment Failure by Release Package
- Release Packages on Environments by State
Timelines
A customizable timeline presents the overall status for release trains in a Gantt chart format. The timeline provided in the default implementation is shown in the following figure.
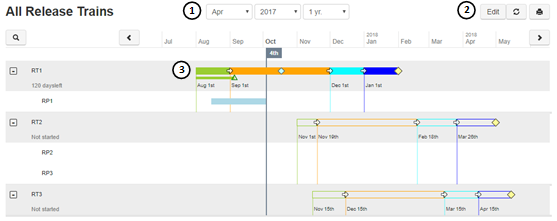
- Select a time range for the data to display.
- Click the
Edit button to change the settings for the
timeline. Note the following:
- To edit the timeline, you must have the Remote Administration privilege.
- When you change the timeline, it is changed for all users.
-
If you change the report to something other than All Release Trains, you must ensure that the selected report has all the fields required for the timeline. You can use the All Release Trains report as a model for a new report.
See Managing Timelines.
- Point to icons or colors on the timeline to see specific details.
The timeline has the following elements:
- Primary items: The main items to track, such as all release trains, are listed on the left. Information for these is plotted on the timeline.
- Ranges: The range of time each item is being tracked is displayed horizontally across the timeline as colored bars. Ranges must have a start date and an end date and can optionally have actual start and end dates.
- Events: Single points in time for tracked events, such as milestones and gates, are represented on the timeline with icons. Like ranges, events can optionally have actual dates and icons configured for comparison.
- Overlays: Ranges and events for items tracked in relation to the primary item can be plotted directly on the timeline of the primary item. These come from a different report than the primary items and are linked with a relational field.
- Child items: Child items can be plotted on the timeline beneath their parent items, such as child release packages or release packages attached to release trains. Child items can have their own ranges, events, and overlays.
For information on customizing the timeline using the Timeline Manager, see Managing Timelines.
Calendar Views
Release Control provides several system Calendar views that show various release metrics in a calendar format. Each of these system views has feeds that show schedules for each application; users can choose which of the feeds to view for a browser session.
Activity Views
Release Control provides system Activity views that give users easy access to release items based on feeds.
Three types of Activity views are provided:
- Release Activity
Shows all release trains, approvals, environments, task templates, and release packages.
- My [Activity]
Depending on the selection in the navigation pane, shows all items owned by the current user. For example, "My Approvals" shows all approvals owned by the current user.
- All [Activity]
Depending on the selection in the navigation pane, shows all items. For example, "All Trains" shows all release trains in the system.
Administrators can edit and remove the default feeds from each system Activity view. They can also add custom feeds. These changes are visible to all Release Control users.
Users can add Activity feeds to the system views, but they can remove only the feeds they have added.
Custom Reports
Release Control includes the power of SBM reports, enabling you to define search, display, and sort information for release activities. Reports offer real-time data based on the report criteria, giving users current information when they need it. Several types of report formats are available, including lists, tables, and charts.
Reports can be added to Dashboard views. For details, see the Work Center help.