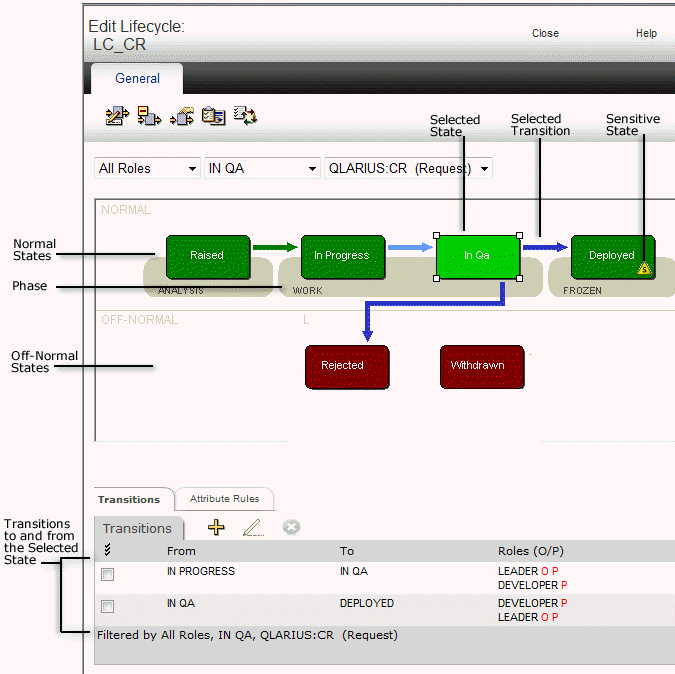
The Interactive Lifecycle Model has two rows showing transition states. You can scroll this diagram horizontally if it is wider than the window. The first row shows the normal transition states, in the path in which they are followed. They are connected by gray arrows that indicate the normal transitions. The second row shows the off normal transition states.
You can select a state by clicking it or by choosing it in the State filter. The arrows representing the possible transitions into that state become highlighted in light blue, and the transitions out of it become highlighted in dark blue. When a state is selected, the Transitions area only shows the possible transitions to and from that state, whereas when no state is selected all the transitions for the lifecycle are shown.
When a request type is selected in the Object Type filter, and phases have been defined for that request type, the phases are shown as a gray background against the lifecycle states to which they apply.
When an item type is selected in the Object Type filter, and build stages have been configured for Dimensions Build for that item type, the build stages are shown as a gray background against the lifecycle states to which they apply.
If a lifecycle state has been defined as sensitive, this is indicated by the following icon: ![]()
You can create a new transition by clicking in one state and dragging the mouse pointer into another state. This displays New Transition dialog box.
Lifecycle Model with a State Selected

Related Topics