Gantt Charts are the primary tool for project managers, and are the main workspace of your project. A Gantt chart consists of a hierarchical spreadsheet on the left which lists your tasks, and a time-scaled diagram off to the right. It enables you to see both the tasks in your project, their structure, and their ordering in time.
The spreadsheet shows the Work Breakdown Structure(WBS) of your project with tasks broken down into various levels of detailed subtasks. You can create a task hierarchy directly on the spreadsheet by selecting task rows and clicking on the indent/outdent buttons. The context menu you get when right-clicking on the spreadsheet will give you these options as well.
Using the Mouse
By clicking and dragging, you can perform several manipulations on tasks. The mouse cursor will change based on where it is positioned and will guide you on the action that will be taken. You can:
- Extend/Reduce a task's duration
- Change task percent complete
- Move a task forward or back in time
- Linking tasks - when the mouse cursor leaves the current row, it automatically switches to link mode.
You can also perform the following
- Selecting links: The mouse cursor becomes a cross-hairs when over a link. Click to modify or remove it.
- Split a task (after right clicking to get context menu and choosing the Split Task option), click on the task to split it where you want.
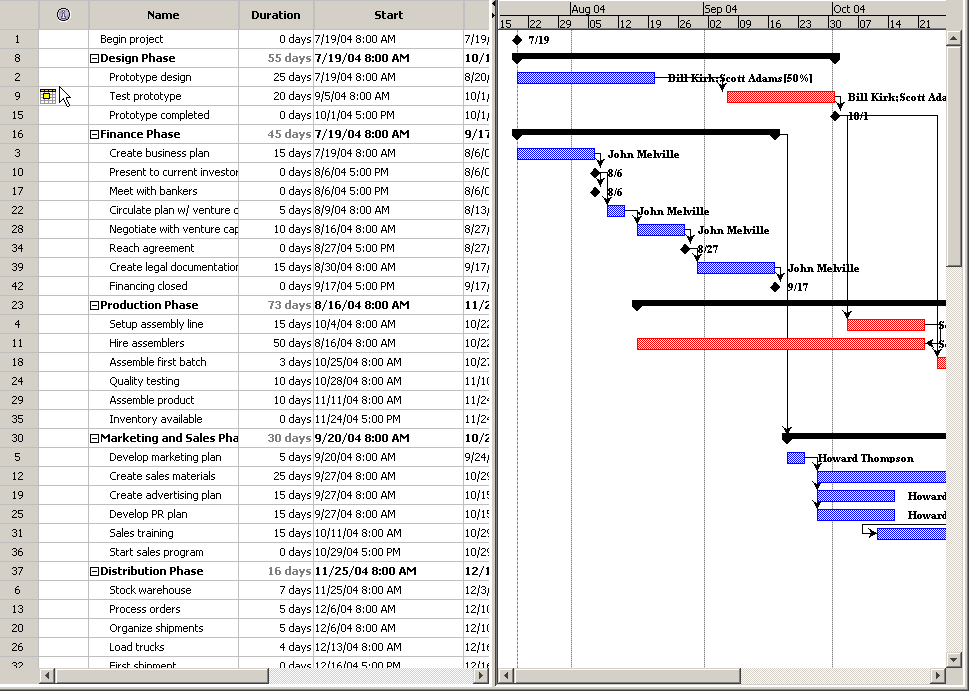
The diagram part of the Gantt Chart shows a time axis on top, with bars for each task in the spreadsheet. By default, the diagram shows the following:
Standard Gantt features
- WBS Hierarchy: Parent tasks show up as black bars with endpoints. They span the duration of their children.
- Normal tasks (without children) are displayed with bar or bars showing when they are active.
- Critical/Noncritical status: Critical tasks show up in red, non critical tasks show up blue.
- Predecessor links: arrows are drawn which indicate dependencies between tasks.
- A background showing gray regions for non-work days according the project calendar.
- Labels to the right of tasks showing assigned resources, or in the case of Milestones, their dates.
Additional Gantt diagram features
- Baselines
- They will show up automatically if you save a baseline (see Tracking Menu)
- Since they take up space, they will increase the space between lines
- Free Slack and Total Slack (also known as Free Float and Total Float)
- Bars for assignments
Changing the Gantt appearance
- You can choose to show or hide the above by right clicking on the Gantt to display the Gantt context menu.
- You can zoom in and out to change the date span by using the magnifier toolbar buttons.
- You can use Filters, Sorts, and Grouping to change what tasks are shown and how they are organized.
- If the start of the Gantt Chart is not visible for some reason, it can be made visible by reentering the project start date.
Printing the Gantt chart
- Printing will use your current time-axis, filter, grouping, sorting, and spreadsheet settings.
- If you wish, you can print just the spreadsheet or just the chart instead of printing both. See Print Preview for details.
-
There is currently no fit-to-page option. However, you have some control over what's printed by zooming the time axis and modifying what columns are displayed in the Spreadsheet. You can also fold tasks that are not necessary to see.
The only option in OpenProj to plot a large Gantt chart on one page is to use a PDF writer (such as CutePDF on Windows or CUPS on unix/linux). Select that as the printer, set page size to A0 (or other plotter size), then using Print Preview, select [One Big Page] on the menu bar at right and print.
Projects On Demand lets you customize your document so you can scale it to a specific number of pages. In addition, it also has native PDF printing functionality. See the Print Preview dialog.