Your company has a common resource pool across all its projects. Only POD Administrators may modify the resource pool. This ensures that the resource pool remains coherent. All POD users are automatically present in the resource pool. You can add non-user resources and modify the properties of any resource by opening up the Master Project (Resource Pool) in the planner. POD Administrators will get this option at startup of the Planner.
A common concern is to make sure your resources are available. Both the Histogram and the Resource Gantt Chart can be used to see resource usage across all projects.
THIS IS ONE OF THE SCENARIO/CHAPTER THINGS IN THE WIKI
A common way to assess your current Resource usage and possible over-allocation is with the Projity Histogram. You can split the screen and show the Gantt Chart on the top frame and Histogram on the bottom frame. These work together in regards to the data displayed. When you are in the Gantt Chart select.
- View from the tool bar
- Histogram
The Histogram will display as a pane on the bottom of the Gantt Chart. You can resize the horizontal and vertical panes by placing the cursor on the separator and it will become arrows, depress the left mouse button and you can drag the vertical separator left or right and the horizontal separator up and down. It is also important to note, you can once again change the time scale of both the Gantt and Histogram with the magnifying glass icons on the toolbar. When you first see the Histogram it will probably be blank. That is because no tasks in the Gantt chart or resources in the Histogram are selected to be shown. In the Projity Histogram you can select both the Resources to be display along with selecting specific tasks or phases. This gives you powerful analysis capability.
- Click with the left mouse button on the top corner of the spreadsheet to "Select All" tasks
- Click on the Lucie resource in the Histogram pane
Your screen should look as below:
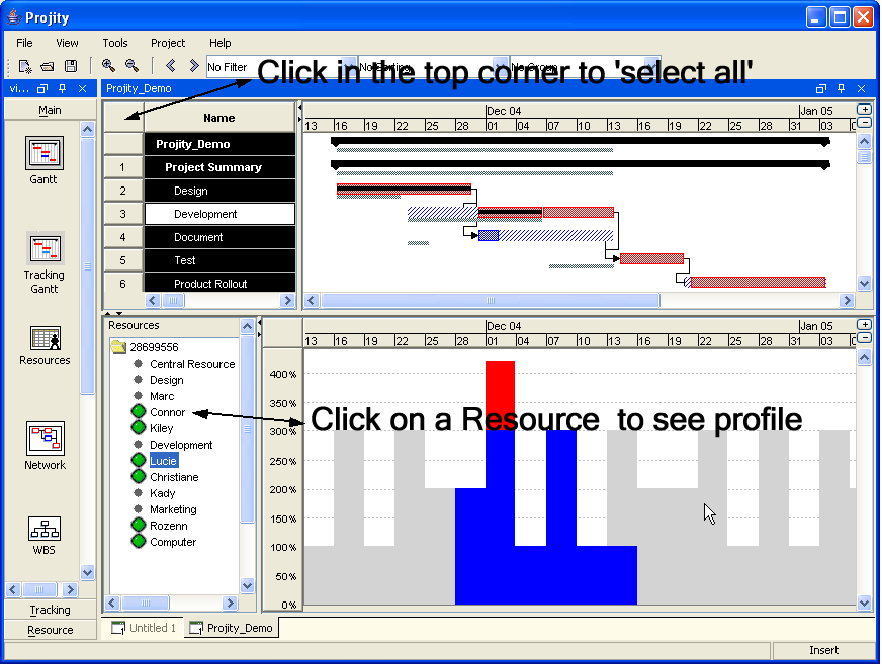
Note: You can click on the other resources which have Green indicators next to them (showing they are assigned) and see the various resource allocation profiles for the respective resources. If your timescale is too detailed you should click on the magnifying glass to decrease the time units and show more information.
The Histogram screen is divided into quadrants. The top two quadrants are the standard Gantt Chart. You use the Task list to select the tasks in which you are evaluating resources. You can click on the top corner cell (above the 1 and left of Name) to select all tasks in the project. You can also click on a task name and depress the shift key on your keyboard, when you click on the another task you will have selected all the tasks in between as well.
If you want to specify tasks that are not sequential, you can click on a task name and depress the Ctrl key on your keyboard and then continue to select specific tasks. The bottom two quadrants are the Histogram. The right is the graphical display. You can see the different colors represent various states of the resources displayed. If you see Red bars or tops of bars that selected resource(s) in that time period this indicates the resources are over-allocated in that time period. If you see blue bars, the chosen resources are Allocated but not over allocated, the gray means the Resource is available.
- In the Gantt chart spreadsheet click on the top corner cell (above 1, left of Name)
- All the Tasks should be highlighted, we have selected to analyze the resource usage against the entire project
- Projity defaults to all resources selected
- The Blue bar you see in the histogram is a summary of all resources assigned to all tasks in the project
We now want to take a look at different scenarios. Lets keep all of the tasks selected but in the bottom left quadrant we will select particular resources to evaluate.
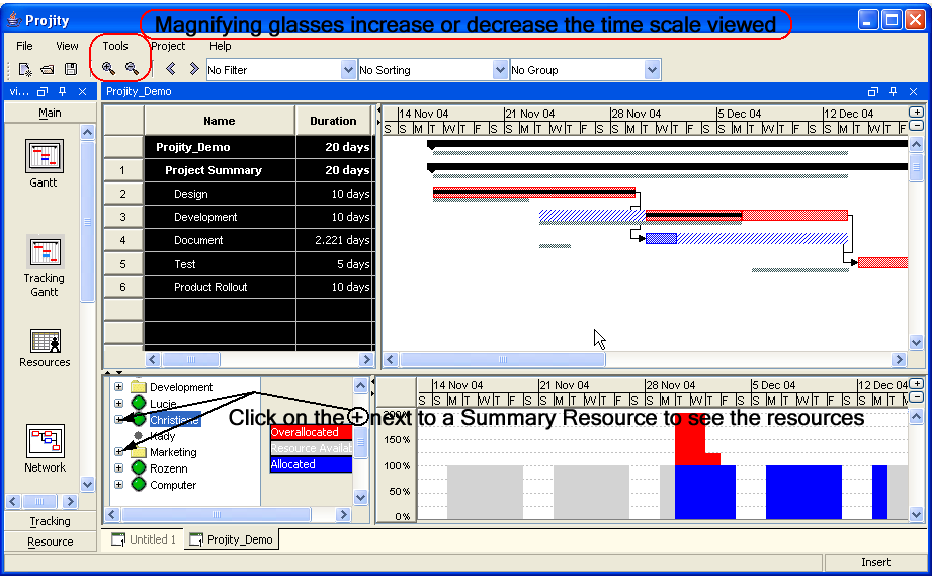
- Click on the icons and make sure your timescale is in days (just for this exercise, you may prefer weeks or months when using Projity)
- Click in the bottom left Quadrant, it says resources
- Click on the + next to the Central Resource Pool
- Click on the + next to the Development resource summary
- This will expand them and you can see the individual resources
- Click on Christiane (it should be highlighted in blue as shown below)
Your screen should look like this
You can see that on the left side of the Histogram the bars are Gray. It turns out Christiane is not assigned to any tasks these days so that makes sense. On Tuesday and Wednesday the week of November 4th you can see that the resource has both a blue and red portion of the bar. If you remember correctly we assigned Christiane to both the Development and Document Tasks in our sample project. If you look on the Gantt Chart directly above the red bar this corresponds with their timeframe's. Thus, it once again makes sense to see the over-allocated Red portion of the bar. If part of the Histogram is cut off you can scroll up with the bar on the right side of the Histogram, or you can resized the horizontal separator up.
In Projity you can select both the tasks to be evaluated for the Histogram and also select the resources. Once again, you can see that the Christiane resource is over allocated. In effect we have her assigned to be working on two tasks simultaneously. If this is not rectified one of the tasks will certainly not be completed on time.
THIS MIGHT BE BETTER UNDER A "RESOURCE TRACKING" CATEGORY
The Histogram shows resource usage for one or more tasks in a task plan, as well as total resource usage across all task plans(?). This can be helpful when determining which resources to allocate and assign, and which resources are available.
Shows the available resources.
Show Selected on Top
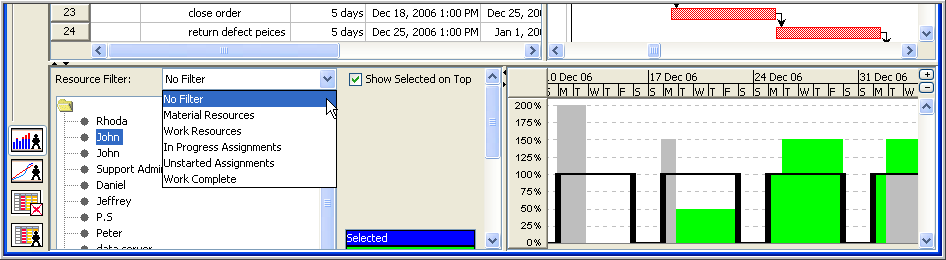
Resource Filter -- No Filter, Material Resources, Work Resources, In Progress Assignments, Unstarted Assignments, Work Complete
BAR COLORS
Blue = Selected
Green = This Project
Grey = Other Projects
Black = Resource Availability
There's a calendar here too.
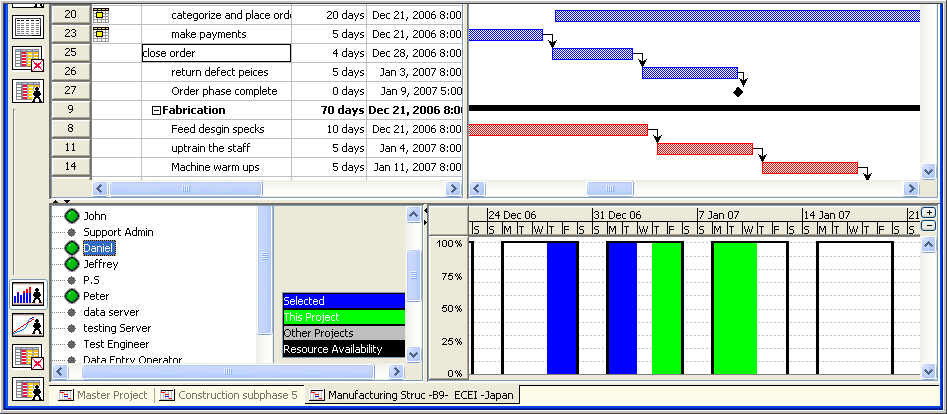
The Histogram provides managers with the details of resource assignments in a graphical view. Using this feature Mangers can view resource allocation details of any particular resource or a group of resources. The Histogram View provides resource loading details for the current tasks' selection, current project, or all projects (POD only) as well as a line for resource availability.

When a task is highlighted and a resource is selected from the Histogram tree, the Histogram graph shows the allocation details of that resource in relationship to the selected tasks in blue.
For example: When the task Sample Design is selected and a resource named Yoshi is highlighted, the areas in the graph denoted in blue show the assignment details of Yoshi for the selected task. One can also select multiple tasks and view the assignment information for the highlighted resource
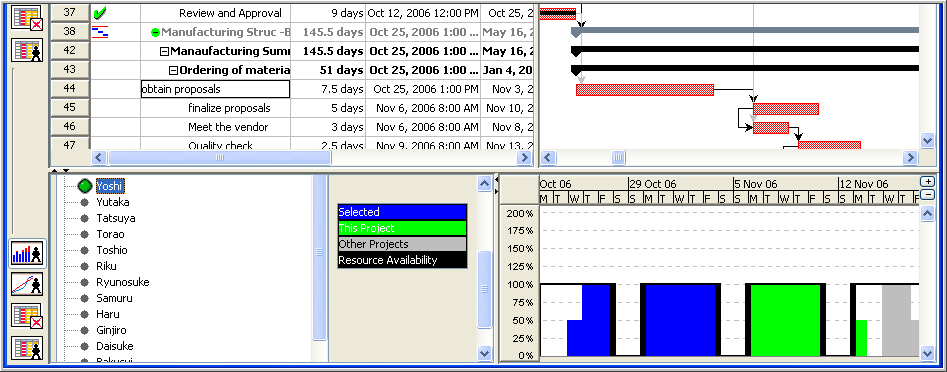
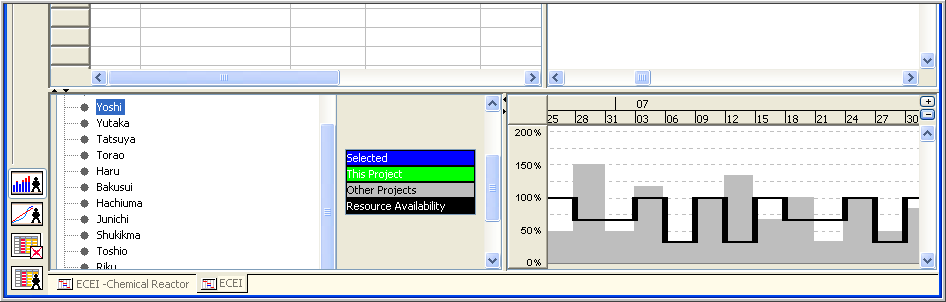
Using the Histogram view, the Manager can view the resource assignment details of resources for the entire project by selecting the resources in the Histogram tree. The area that is highlighted in green in the Histogram chart shows the resource assignments details for the entire project for the selected resources.
Other Projects
To prevent over-allocation and use resources optimally, managers need to know the assignment details of the resources and there remaining availability across all the projects. This can be viewed by selecting the resources in the Histogram tree. The area that is marked in grey denotes the assignment of the selected resources in all the projects.

Resource Filter
A Resource Filter is provided in the Histogram view to filter the list of entries in the Histogram tree. Managers can easily filter Material and Work resources.

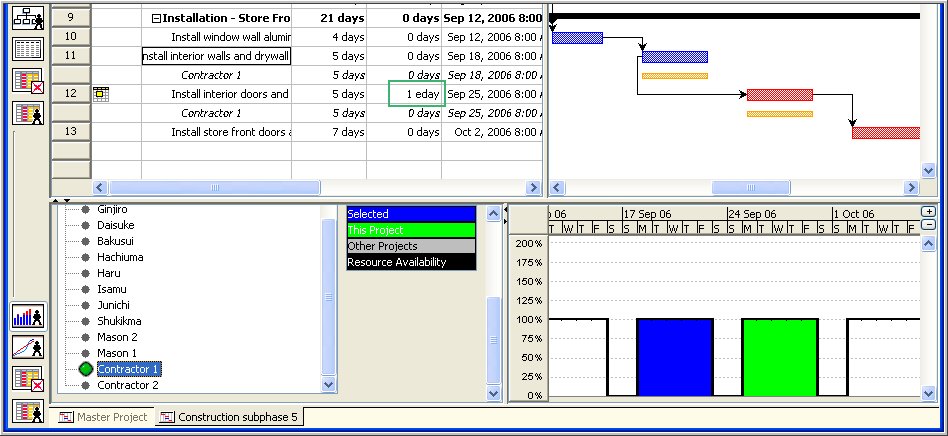
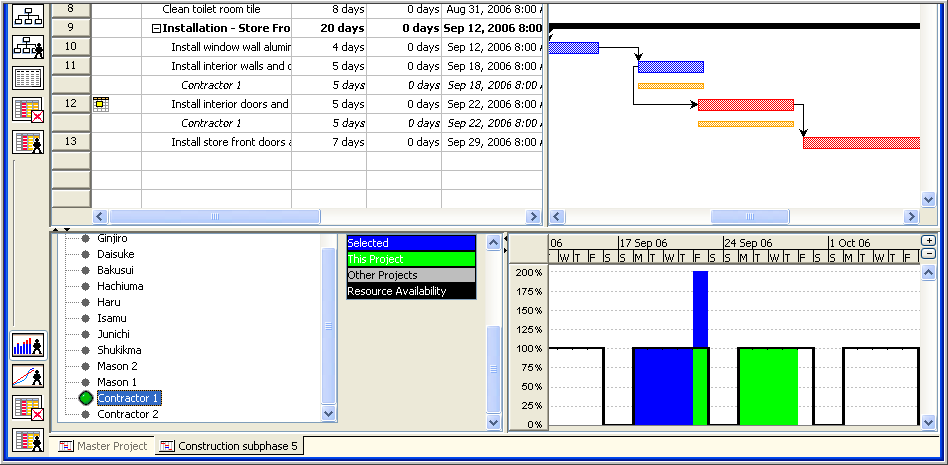
Manual Leveling
Managers can perform manual leveling based on the over-allocation information provided by the Histogram. For example, Contractor 1 is 200% loaded based on the histogram data on the 22nd of Sept.

The Manager can show the Leveling delay column and insert delay of 1 Ed for the task Install Interior doors. This will level over-allocation of the selected resource.
The Histogram provides managers with the details of resource assignments in a graphical view. Using this feature Mangers can view resource allocation details of any particular resource or a group of resources. The Histogram View provides resource loading details for the current tasks' selection, current project, or all projects (POD only) as well as a line for resource availability.
When a task is highlighted and a resource is selected from the Histogram tree, the Histogram graph shows the allocation details of that resource in relationship to the selected tasks in blue.
For example: When the task Sample Design is selected and a resource named Yoshi is highlighted, the areas in the graph denoted in blue show the assignment details of Yoshi for the selected task. One can also select multiple tasks and view the assignment information for the highlighted resource.
Using the Histogram view, the Manager can view the resource assignment details of resources for the entire project by selecting the resources in the Histogram tree. The area that is highlighted in green in the Histogram chart shows the resource assignments details for the entire project for the selected resources.

To prevent over-allocation and use resources optimally, managers need to know the assignment details of the resources and there remaining availability across all the projects. This can be viewed by selecting the resources in the Histogram tree. The area that is marked in grey denotes the assignment of the selected resources in all the projects.
A Resource Filter is provided in the Histogram view to filter the list of entries in the Histogram tree. Managers can easily filter Material and Work resources.
Managers can perform manual leveling based on the over-allocation information provided by the Histogram. For example, Contractor 1 is 200% loaded based on the histogram data on the 22nd of Sept.
The Manager can show the Leveling delay column and insert delay of 1 Ed for the task Install Interior doors. This will level over-allocation of the selected resource.
