-
Set the reporting period.
Use theDate Range date-picker to set the report's start- and end-dates. The selected value(s) determines the columns in the tabular report, and the coordinate interval on the graph's x-axis. Default value:Current Month.
Date Range
| Field |
Description |
| Current, Prior Week |
Start day is either Sunday or Monday, depending on what is defined in your system. Reporting interval is set to days. |
| Current, Prior Month |
Start day is first day of the month. Reporting interval is set to days. |
| Current, Prior Quarter |
Quarters are bound by calendar year. Reporting interval is set to weeks. |
| Current, Prior Year |
Reporting interval is set months. |
| Custom |
Displays the Custom pop-up which enables you to pick an arbitrary start- and end-date. |
The start-time is automatically set to 00:00 (24-hour clock) for the selected date in the reporting period.
The end-time is automatically set to 24:00 for the selected date.
-
Set the report filters.
Filters are set with the properties drop-down list boxes. To set a filter, select it from the corresponding property list box.
Filters table
| Field |
Description |
| Application |
Only deployments executed by the selected application(s) appear in the report. To select applications:
-
Click Application.
-
To include an application in the report, click the corresponding check box. If a large number of applications are listed, type the first few letters of the application's name in the text box to scroll the list. Multiple applications can be selected.
-
Click OK.
|
| Status |
Only deployments with the selected status appear in the report. Default value:Success or Failure, which means all deployments. |
| Plugin |
Only deployments that used the selected plug-in appear in the report. Default value:Any. Note: theAny value also includes deployments that did not use a plug-in. |
-
Run the report.
Click Run to apply your filter conditions to the data and produce the report.
A tabular report and line graph are produced.
Deployment Count Graph
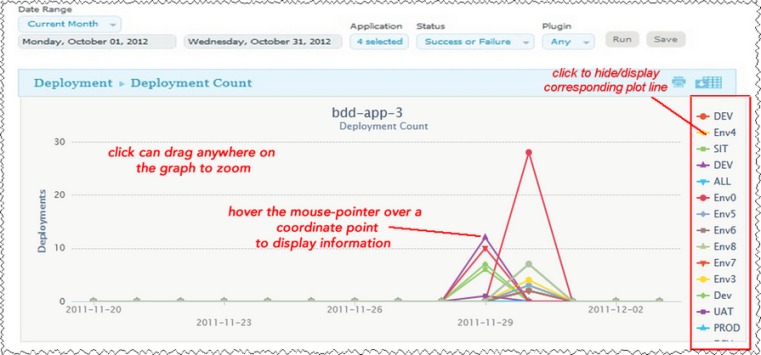
Each environment used by a reporting application is represented by an individual plot line and table row. You can hide a plot line by clicking the corresponding item in the graph legend. To see information about a graph coordinate, hover the mouse over the graph point.
You can zoom a graph area by dragging the mouse over the area.
For information about saving and printing reports, see Saving and Printing Reports.