Deployment reports contain historical information about deployments, such as the total number executed and their average duration.
The Deployment > Reports page is shown in the following figure.
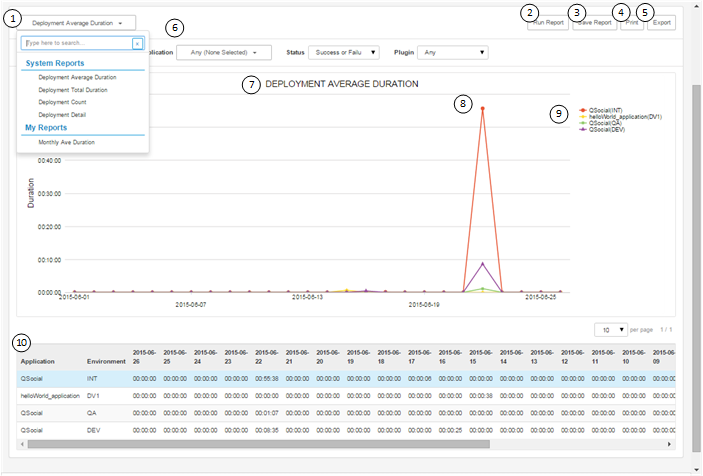
- You can select from default reports or reports that you've saved with specific report criteria. When you select the report that you want to run, the selected report appears on the page.
- Run the report to apply your filter selections.
- Save the report selections. Saved reports appear in the My Reports section of the selection box.
- Print the report.
- Export the report. The tabular data is downloaded in HTML format.
- Select from report filters, which vary by report type.
- View a graphical or listing report, depending on the report type.
- For graphical reports, you can hold your cursor over a graph point to see more information, or grab a point on the graph and drag to zoom in or out.
- For graphical reports, view the report key to see the meaning of lines by color and graph point shape.
- Tabular reports follow the graphical reports.
For information on each report, see the following topics: