Timelines show the number of processes run and graphical indicators of success or failure.
You can view timeline information as follows:
- Deployment > Timeline: timeline of all deployments run in the given time range for this Deployment Automation server
- Management > Environments > (selected environment) > Timeline: timeline of all deployments run in the given time range for each application environment based on this environment
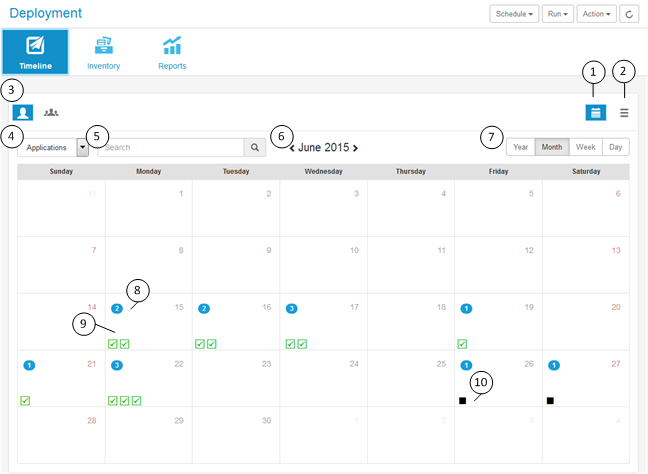
The Deployment Timeline is shown in the following figure.

- Click the calendar view icon to see the calendar view. (Default; not available in environment timelines)
- Click the grid view icon to view a list of processes. (Not available in environment timelines)
- Filter by deployments owned by you or by everyone. (Not available in environment timelines)
- Select to show deployments for applications, components, or snapshots. (Not available in environment timelines)
- Search for a request name; this narrows the display to just the entries including that name. (Not available in environment timelines)
- Use the arrows to change the year, month, week, or day viewed in the calendar, depending on the period selected.
-
Select the period to show.
-
Click the number icon to view the request names, and then click a name link to go to the request page.
-
Move your cursor over the success or failure icon to view information about the request.
-
Move your cursor over the schedule blackout icon to view information about blackout dates.