Content Options
The following options are available in the Content area for Elapsed Time Duration reports:
-
Report Item Type
Indicates the application the report is based on.
-
Report Project
For reports based on primary tables, the project you select when creating a report determines which items are returned in your report. The project selection also determines where the report is stored and which users can access the report. For example, if you select Project A, only users who have privileges to run reports in Project A can run the report.
For details, refer to Selecting a Report Project.
- Report Style
Choose how to display your report.
Consider the following information when you select a report style:
- For graphical reports, labels may be truncated for fields that contain long selection values.
- If you select a tape chart and your data set contains more than five items, the lines in the chart may appear as black.
- The tape chart, area chart, and line chart styles do not display any data if the X axis contains only a single data point. For example, if you create a Distribution report, select a project with no sub-projects, and then set Project as the Row entry, no data appears for these styles. If you select a project with sub-projects (and there are items in the sub-projects), data is shown.
- Time Period
Specify a time period for the report. You can either specify a fixed period using a date range or a time period based on a number of days, weeks, or months that have passed prior to running the report.
- Fixed Period
- Start Date
This field is required; however, the time of day is optional. Click the calendar icon to select a date, enter a date specification using the format indicated below the input field, or click Date/Time Keywords to use date values that are recalculated instead of a fixed date when the report is executed. You can also type custom values, such as Minus 5 or Plus 5 (with a different number, if desired) to use custom plus and minus values.
Select the Query At Runtime check box to require users to enter the Start Date when the report is executed.
- End Date
This field is optional. If you do not specify an end date, the report uses the current date. Click Date/Time Keywords to use date values that are recalculated instead of a fixed date when the report is executed.
Select the Query At Runtime check box to require users to enter the End Date when the report is executed. You can also type custom values, such as Minus 5 or Plus 5 (with a different number, if desired) to use custom plus and minus values.
- Start Date
- Relative Period
- Last
Enter a number of preceding days, weeks, or months to limit report results.
- Last
- Fixed Period
- Select States
Select one or more states to display how long items have remained in that state. If you select multiple states, the results will be the sum of time that each item has remained in the collection of states. For each time interval group (see the entry for Time Interval Groups below), the report displays the number of items that have been in those states for that length of time (for example, the number of items that have been in the New and Assigned states for less than 10 days). You can choose to divide the results by a particular field (see entry for Group By) which would result in multiple columns for each Time Interval Group.
- Select Multi-Calendar
Select a calendar to use for determining durations. The calendar that you select determines how time is calculated. For example, if your calendar has 8 hours per standard working day Monday through Friday, and your item has been in the state from Saturday to Tuesday at noon, then the item will have been in the state for 12 hours or 1.5 days.Note: Calendars are created in SBM Application Administrator.
- Total By
Choose to increment results in days, weeks, months, or quarters. The date and time selected as a start date determines the beginning of the increment period. For example, if you specify Feb. 15 as a start date and select Quarters from the Increment drop-down list, report results are organized by quarter beginning with Feb. 15. For monthly increments, if you select a start date that does not apply to all months, such as Jan. 31, that date is only used when it applies. In addition, the specified end date is increased when needed to reflect an entire time period. If your last column starts at 3/30/2013 at 5 a.m. and you selected a monthly increment, the end date for the last column is 4/30/2013 at 5 a.m. For details on selecting start and end times for Trend reports, refer to Search Filter.
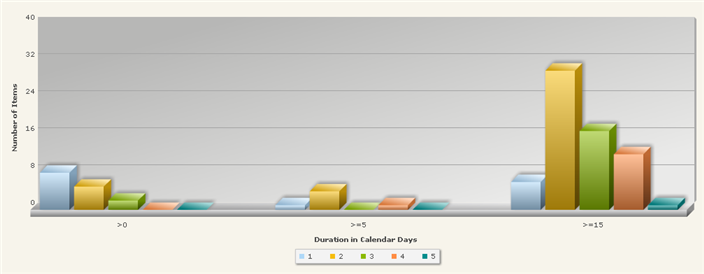
- Time Interval Groups
Select one to four time intervals. For example, if you entered 2 days, 5 days, and 10 days, the report shows duration groupings of:
- Less than two days
- Two days to less than five days
- Five days to less than ten days
- Greater than or equal to ten days
- Group By
This field is optional. If you select a field by which to group items, one bar appears for each value for that field that occurs within the results for each time period. For example, if you select the Severity field, and that field has Sev 1, Sev 2, and Sev 3 as possible values, three color-coded bars appear within each time period grouping, one for each severity level.
Search Filter
Search filters enable you to narrow your search for items.
Select the following options for creating a search filter for your report:
| Option | Description |
|---|---|
| Include Items From Sub-projects | Select this check box to include items from sub-projects of the project selected from the Report Project list. This option is not available for reports created against auxiliary tables. |
| Show Search Filter In Results | Select this option to display your Search Filter settings in the output of the report. This option allows report viewers to see which filters are used in the report. It is also helpful when you select to print a report, since it displays which Query At Runtime parameters were selected. |
| Limit selections using field dependencies and project selections |
Select this check box to use the project's field dependency rules. For example, in Project A, the Priority field has a dependency with the Severity field. The dependency states that when the Severity field is Critical, then the Priority field must be 1 or 2. You create a report on Project A and add a Search Specification of Severity in Critical. Then, you add a Search Specification for the Priority field. The available Field Values for the Priority field will be limited to 1 and 2. Changing this setting does not affect values that have already been selected. Restriction: Dependencies are only honored for
fields that have the
Allow searching option selected in
the field definition.
|
| Basic Conditions |
When you select a field from the Fields drop-down list, the Operator drop-down list contains values appropriate for that field, and the list box underneath the list of field values contains the possible values for that field. In some cases, you see a search icon, which you can use to filter the list of values. Select an operator, and then select the value or values that constitute your search criterion. Note: If there are arrow buttons and a second list box to
hold field values, you can either use the arrow buttons to move values that you
want in your criterion into the right-hand box, or you can multi-select the
values in the left-hand box; however, do not use both mechanisms at once.
Click OK to save your criterion. |
Additional Options
- Use Logarithmic Scale (Graphs
only)
Select this check box to apply a logarithmic scale to your report. You may want to do this to reduce your report results to a manageable range if they cover a large range of values. This option only applies to certain report styles, such as line, scatter, and bar charts.
- Show Whole Rows and Columns of Zero
(0)
By default, Distribution reports do not show rows that have only zeros as values. Select this check box to show the rows that only have zeros as values.
- Show All Labels
Some display labels are skipped if a large number of values is returned on the horizontal axis. Select this check box to show all labels. If the labels are difficult to read, clear this check box to show fewer labels. This option does not apply to tabular reports.
- Show Chart Values
Select this check box to show the number of items returned for each row on the graphical report. If a large number of values are returned, they may be difficult to read. You can clear this check box to show fewer values. To see values, hover your mouse over a bar or pie segment to view the number of items returned. This option does not apply to tabular reports.
- Footer
Optionally, supply a footer for your report.Note: The footer renders some common HTML tags such as <i>, <b>, and <font>. However, this means that character entity references such as >, <, ", and & are not encoded in the footer. Therefore, in order to display <Some Text> in the footer, you must send the following encoded sequence: <Some Text>.
- Choose Colors for
Values
Choose custom colors for values for the Group By field you selected on the Content tab. If you do not select colors, random colors are used.
Drill-Down Display Options
- Drill-Down Display Options may not be available if your administrator has disabled Flash components or in browsers that do not support HTML5.
- You cannot drill down into a report when it is contained in a Drill Through report and used to drive another report. See Drill Through Reports for more information.
| Field | Description |
|---|---|
| Use Value Display Format | Select this check box to use the default columns for the drill-down report. Clear the check box to enable the Select Columns to Display feature. |
| Select Columns to Display | Select the fields that you want to appear as columns in the drill-down reports. To select or deselect a field, move it to or from the right-hand box using the arrow buttons. |
| Set Custom Field Widths | Optionally, specify the width (in pixels) for the columns in the drill-down reports. |
| Sorting | Select the fields on which you want to sort the data in the drill-down reports. |
Results
Elapsed Time results appear in a bar chart, with items grouped based on the selected time interval. If you have selected to group items by a particular field, you will see multiple bars per time interval.