Key Benefits
- Drill Through reports are interactive reports driven from a distribution report, that allows users to see different dimensions of the data from the same application.
- Drill Through reports create a full spectrum multi-view report with high-level visibility and the ability to drill through into more granular details.
Content Options
The following sections describe the configuration options available in the Content area for Drill Through reports:
Selecting Reports and Data Bindings for Your Drill Through Report
You can add any report that you have privileges to run to a Drill Through report, except:
-
Reports that contain query-at-runtime parameters
-
Deleted Item reports
-
Multi-View reports
-
Other Drill Through reports
To select reports for a Drill Through report:
-
Select your driving report by searching for your report and choosing it from the results.
- The Driving Report report is a Distribution report that contains the data that you want to "Drill Through" to.
- To search for a report in the list, type a keyword or part of a
keyword contained in the report title in the box next to the
 button, and then click
.
button, and then click
.
- Select Report 2 using the same process. Note that Report 2 will be driven by the Driving Report.
-
Right-click on the arrow between the Driving Report and Report 2, and select the data that you want to pass from the Driving Report to Report 2.Important: The arrow only becomes active after you select Report 2.
See Results for an example of how you could configure a Drill Through report.
- Repeat Steps 2 and 3 to add additional reports such as Report 3 and
Report 4.
Note: If you do pick a report with drill down functionality and if you have not set any drill through rules, then when the user clicks on the report, the drill down functionality will be active. If the drill down report is set with drill through rules, such as the Driving Report, then the drill down functionality will be deactivated.
To remove a report from the box, select it and click
 .
This will cause all of the reports to move up one space. For example, if you
delete Report 2, then Report 3 will move to Report 2's location. Note that you
cannot delete the Driving Report; however, you can replace it by selecting a
new one.
.
This will cause all of the reports to move up one space. For example, if you
delete Report 2, then Report 3 will move to Report 2's location. Note that you
cannot delete the Driving Report; however, you can replace it by selecting a
new one.
Selecting a Layout Design for Your Drill Through Report
You can choose from several layout designs to display your Drill Through report. By default, reports included in a Drill Through report are displayed in a grid format in the order specified in the Select Layout box. For best results, use this layout design for Listing-type reports.
You can also choose to display reports side by side or in a variety of other layout designs. Graphical and tabular reports are best suited for these layout designs.
To select a layout design:
-
Click the Up and Down arrows next to the Select Layout box to view the provided designs. The layout design selected when the report is saved is used to display the Drill Through report.
Results
Drill Through reports allow you to click on data in one report and populate the linked reports with the selected data.
The following example explains how you would use a Drill Through report:
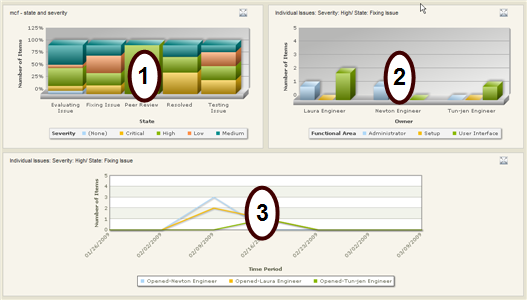
- Report 1 is a driving report. It is a Percentile Stacked Bar chart report that shows the distribution of items based on State and Severity. Click on a segment in one of the bars in Report 1, and then Reports 2 and 3 will be updated with the selected data. The Drill Through report is configured to pass both Severity and State (Column and Row) to the other reports, which means only the items referenced by the particular segment would be passed.
- Report 2 is a bar chart showing the distribution of items for each developer based on functional area. Selecting any of the columns will update Report 3 with the items that you have selected.
- Report 3 is an Open and Completed trend report. It shows the completion trend for the items that were selected in either Report 1 or Report 2.
Zoom Icons
Click the zoom-in icon
![]() to
expand a report to the full pane. Click the zoom-out icon
to
expand a report to the full pane. Click the zoom-out icon
![]() to return to the drill through view.
to return to the drill through view.