Based on the reports that you have created, you can define timeline elements to display the data points you want.
Configuring Ranges
For an overview of the timeline, see Key Metrics.
Navigate to Timeline Editor and continue with the following sections. See Updating Timelines.
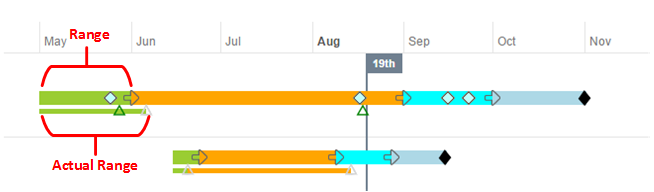
Ranges are the colored bars that render horizontally across the timeline. Ranges must have a start date and an end date. They may also have actual start and end dates, so that you can visually compare planned versus actual. Ranges are shown on an example timeline in the following figure.
To configure ranges in Timeline Editor, do the following:
- Edit an existing range by selecting the options on the form.
- Delete a range by clicking the delete button on the right side of the range row.
- Add a range by clicking the Add Range button, which will create an empty range for you to edit.
- Select from available options:
- Description - This will be displayed as a tooltip when you point to or click a range.
- Color - This is the color of the range on the timeline.
- Start Date (Plan) - This is a selection of all the date fields available in the report.
- End Date (Plan) - This is a selection of all the date fields available in the report.
- Start Date (Actual) - Optional. This is a selection of all the date fields available in the report.
- End Date (Plan) - Optional. This is a selection of all the date fields available in the report.
Configuring Events
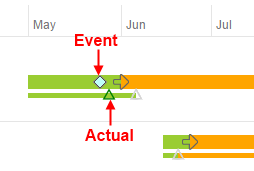
Events are single points in time represented on the timeline with icons. Like ranges, events can optionally have actual dates and icons configured for comparison. Events are shown on an example timeline in the following figure.
To configure events in Timeline Editor, do the following:
- Edit, delete, and add events in the same way as for ranges. The main difference is that since they are a single point in time, you have just one field for each planned and actual date instead of a start and end date.
- Select an icon by clicking the Select link.
- Select from available options:
- Description - This will be displayed as a tooltip when you point to or click an event.
- Planned Icon - This is the con that will be displayed for the planned date.
- Planned Date - This is a selection of all the date fields available in the report.
- Actual Icon - Optional. This is the icon that will be displayed for the actual date.
- Actual Date - Optional. This is a selection of all the date fields available in the report.
Configuring Overlays
Overlays have both ranges and events. They come from a different report than the primary items and are linked with a relational field. You can configure as many overlay items as you need. This enables you to plot ranges and events from different items directly on the timeline of the primary item. In the default configuration, this is used to plot milestones on the release train.
To configure overlays in Timeline Editor, do the following:
- Add an overlay with the Add Overlay Item button at the bottom of the overlays section.
- Delete an existing overlay with the Delete Overlay Item button in the top right of the overlay item.
- Add an overlay by selecting a report that references the primary items with a relational field.
- The required options are:
- Choose Overlay Report - This is a report that has the range and event data needed and references the primary items.
- Relational Field - This is a selection of all fields in the report. You must select the one that relates to the primary item.
Configuring Child Items
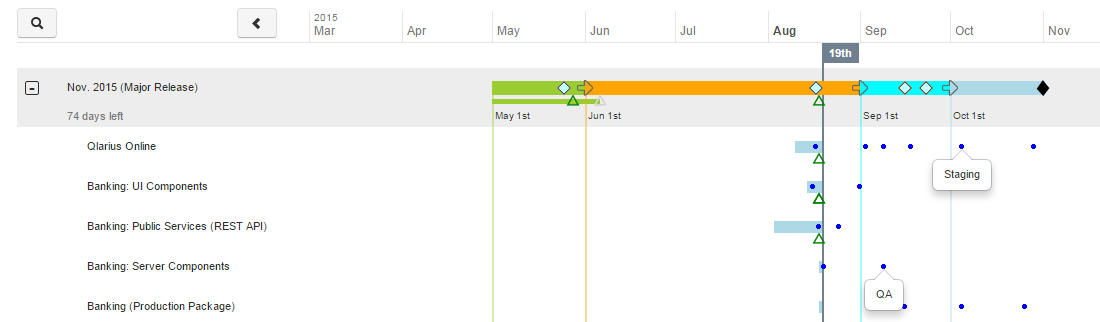
In addition to overlays you can add child items, which can have their own ranges, events, and even overlays. If you expand the primary items you will see all of its child items plotted on the timeline below it. Child items are shown on an example timeline in the following figure.
To configure child items in Timeline Editor:
- Add child items with the Add Child Item button at the bottom of the child item section.
- Delete an existing child item use the Delete Child Item button at the top right of the child item.
- Add a child item by selecting a report that references the primary items with a relational field.
- The required options are:
- Choose Child Item Report - This is a report that has the range and event data needed and references the primary items.
- Relational Field - This is a selection of all fields in the report. You must choose the one that relates to the primary item.
- Filter Description - This is any text that describes the item. This will be used in a future release to filter what is shown by type.
- Add child item ranges and events as you do for overlays.
- Add a child item overlay event by selecting a report and a relational field that relates to the child item.
- Other options are the same as they are for other events.