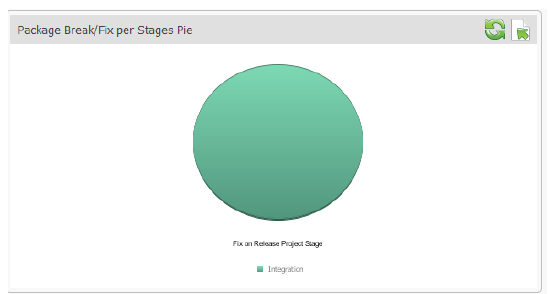
The Package Brea / Fix Per Stages displays the number of break-fixes that have occured in specific workflow states, across all release packages You can display break-fixes in a bar chart or a pie chart. You can click a pie chart to dipslay details about where the break-fixes occurred.
In the example below, 100% of break-fixes across all release packages occurred during the Integration stage: