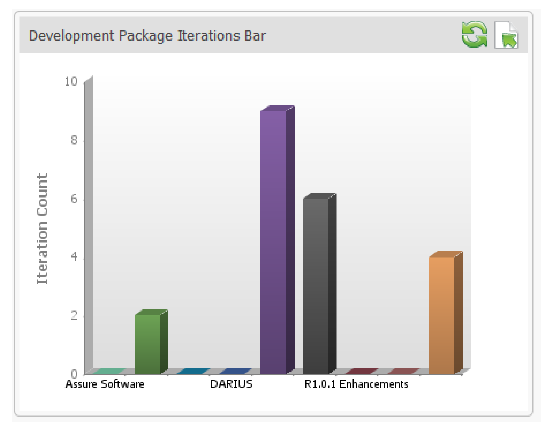
This metric displays the number of iterations that a development package has undertaken. You can display this data as a bar chart:
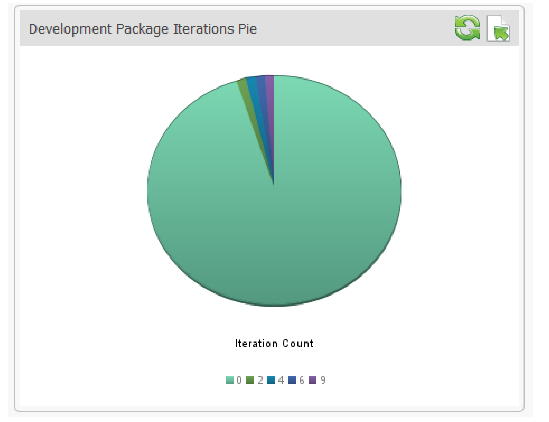
You can also display this data as a pie chart: