With the Deployment Status by Train metric, you can display the specific status of a deployment task with a pie chart, bar chart, or tabular report. When you click the chart you can drill down into specific, detailed status information.
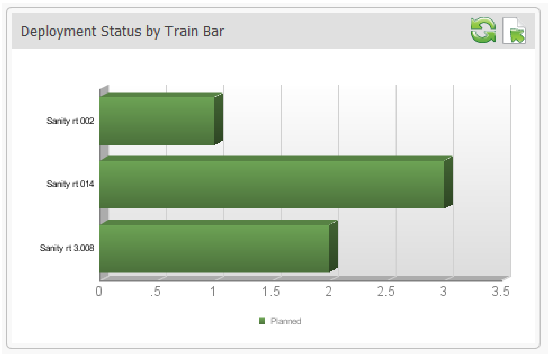
In the following example bar chart, you can see the number of open deployment tasks across three release trains. All of these tasks are in the Planned state.