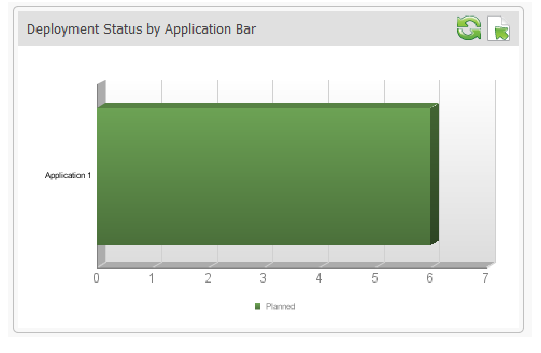
You can display the specific status of deployment tasks in applications. For example, the following instance of the Deployment Status by Application Bar metric tells you that there are six tasks in the Planned stage associated with Application 1:

You can represent this data in a pie chart as well, and click a stage to display detailed tabular information about all deployment tasks.