Open WebFOCUS Developer Studio.
In the Explorer view, under WebFOCUS Environments, expand the Dashboard environment (or localhost, however it is defined), expand EDASERVE.
From here, you can open the \Applications folder and see all of the files for specific WebFOCUS applications. For example, under \developmentmanagerdashboard, you see all of the master files for the Development Manager metrics under the Master Files folder.
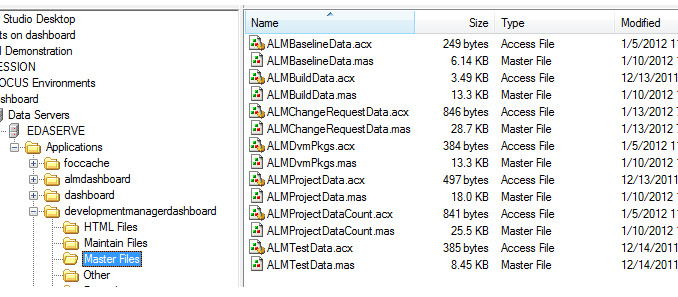
Each of the .mas / .acx file-pairs in this folder corresponds to a synonym, and stores the table definitions for that synonym. Double-click any of the .mas files to view the tables included in the synonym. For example, double-click ALMBaselineData to display the contents of the ALMBaselineData synonym.
From the open synonym file, click the Modeling tab to see the representations of tables.
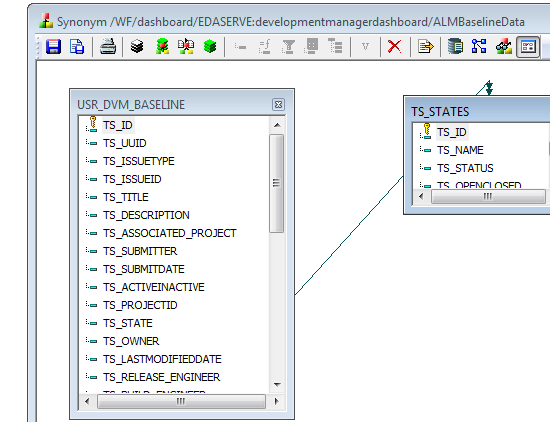
This synonym includes two tables that map to data from the Development Packages process app in Serena Development Manager.