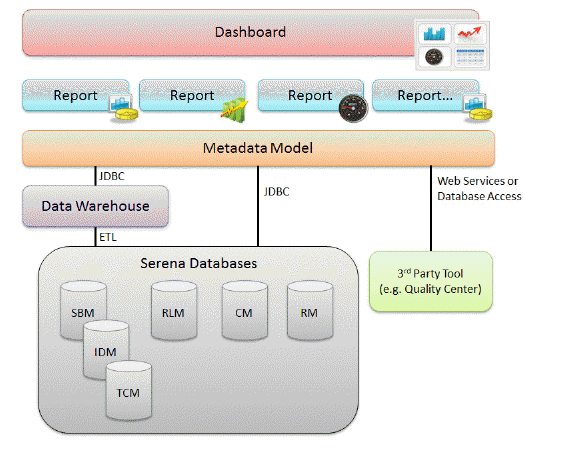
Serena® Dashboard enables graphical views to be produced from data across multiple applications, allowing you to make key business decisions. An overview of its architecture is shown below:

The Serena Dashboard enables you to produce comprehensive graphs, metrics, and views of your ALM processes from different data sources. It retrieves information from the ODBC data sources for SBM and Dimensions CM and also or other third-party tools such as Quality Centre. It provides a set of out-of-box graphs and metrics and enables you to customize them or create your own.
Installing the dashboard involves installing:
IBI WebFOCUS Server (also known as Serena Reporting Server)
IBI WebFOCUS Developer Studio
Serena Dashboard
It then involves some configuration steps to connect to the data sources and enable the metrics in order to display them in the dashboard. This is described in Serena Dashboard System Configuration.