If you have not yet logged in and created an administrative user, you can use the default user called admin with password serena.
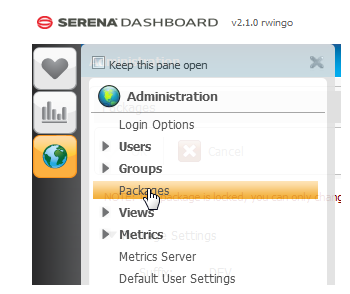
Select Packages from the Admin menu.
Click the Connect to Data Source button.
Choose the type of data source you want to connect to. Your options include Development Manager, Release Manager, Requirements Manager, Sample Data, and ZMF Server. Click Next.
Depending what type of data source you are adding, you must provide the relevant connection information.
-
Release Manager, Development Manager, Release Manager:
-
Choose the database platform that Release Manager, Development Manager, or Release Manager is running on. You can choose Oracle or SQL Server.
-
If you selected Oracle, you must provide the following:
TNS Name: This must be in the format <server>:<port>/sbm
For example: stl-dvm-orcla:1521/sbm
User: The user account for the ODBC data source.
Password: The password for the ODBC data source.
Schema Name: Schema name.
-
If you selected SQL Server, you must provide the following:
Server Name: Name of the SQL Server.
User: The SQL user account.
Password: The password for the SQL user account.
Database Name: Click the Get Databases button to generate a list of available databases. Choose one.
-
If you are connecting to Requirements Manager or Development Manager, click Next to enter connection information either for the Dimensions RM database or the Dimensions CM database. Choose Oracle or SQL server, and enter the TNS or server name, database user and password, and schema or database name.
-
If you are connecting to Development Manager, click Next again to enter connection information for your HP Quality Center database. Choose Oracle or SQL server, and enter the TNS or server name, database user and password, and schema or database name.
-
Sample Data:
This option is available if you have no other data sources to connect to and just want to load some example data into Serena Dashboard. You can generally skip this option.
-
ZMF Server:
-
Under ZMF Server/Subsystems to connect to, enter the ZMF server name, subsystem name, and user name. Click the Add Server button to add the server, and click the Verify Server button to test the connection. You can also double-click a server in the list to remove it.
-
Under Content Settings, choose whether to pull data ZMF package, promotion, or component data. This data is imported separately; if you need all three categories of data, select all three options.
-
Under Cache Settings, choose how frequently you want to update cached ZMF data in the Dashboard. This determines the interval of time between refreshes of the data that Dashboard displays from ZMF.
Click Next to display the Package Settings screen. Because you will import default out-of-box metrics as part defining a data source, you must choose how to organize those metrics into a package. \ A package is simply a collection, or category, or metrics. A package is useful, for example, to categorize all metrics that belong to a particular solution, project, or functional group. Define the following here:
-
Suffix: An uppercase text string the helps identify the package as belonging to a particular project, group, or other criteria. For example, Dev and QA teams might each have their own packages of metrics, and can use the suffix to classify them (such as DEV or QA).
-
A title, version, and description.
-
Choose an option under Access Level to determine who should have access to this package.
Click Next, then click Install Package to add the data source and import the out-of-box metrics for that data source. A confirmation screen appears that lists all of the metrics that have been installed, and all of the views that have been created. You can now click Views to see all of the out-of-box views and metrics for the data source you imported.