Serena Dashboard includes graphs on several Key Performance Indicators (KPIs) and metrics that are relevant to most development organizations. These graphs are configured to work directly out-of-the-box with the default Development Manager configuration. The Dashboard pulls data from the following sources:
The Development Control process apps running on SBM, such as ALM Projects, Dev Change Requests, and Dev Packages.
Dimensions CM, to display data on build success
The following KPI and metric graphs are included.
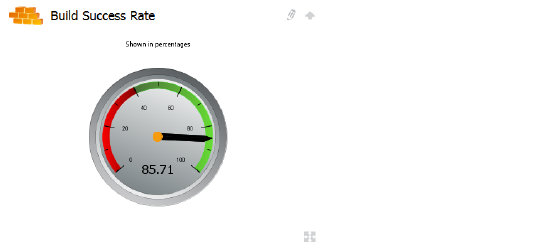
This graph displays the percentage of builds that completed successfully. This data is pulled from Dimensions CM. For example:
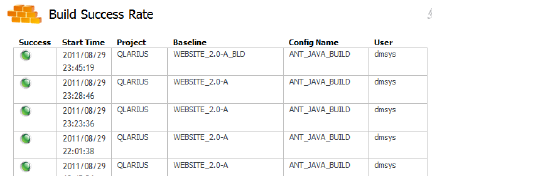
You can click the graph to see information about specific builds, including the name of the Dimensions CM build configuration, when the build stopped, and whether it succeeded.
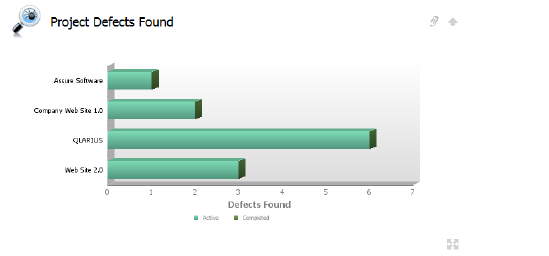
These graphs (Project Defects Found and Project Defects by Month) display, in different colors, the number of active and inactive defects either for particular projects, or found on from month to month. The following is an example of Projects Defects Found.
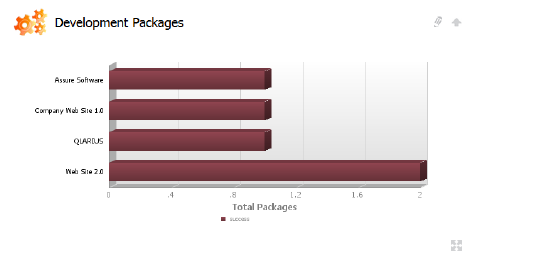
This graph lists the number of development packages in each project defined in ALM Projects. These packages are associated from the Dev Packages process app.
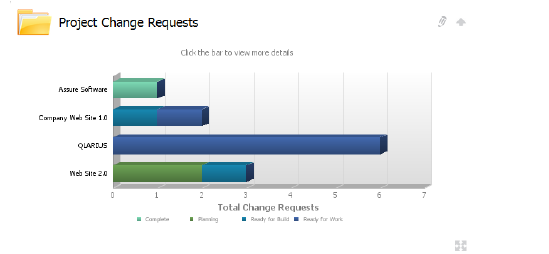
This graph displays the number of open change requests against projects defined in ALM Projects. The change request count is pulled from the Dev Change Requests process app. The change requests are color-coded according to their current state, such as Planning, Ready for Build, Ready for Work, and Complete.
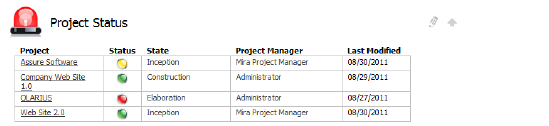
The project status graph lists all current projects in the ALM Projects process app and displays their status as green, red, or yellow. This graph also lists the state that the project is currently in. You can click a project name to drill down into project state, start date, and end date.