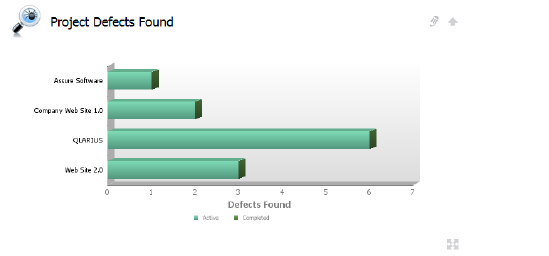
These graphs (Project Defects Found and Project Defects by Month) display, in different colors, the number of active and inactive defects either for particular projects, or found on from month to month. The following is an example of Projects Defects Found.