Screen Shot
![]()
System Settings → Report Templates → System Reports → Project Portfolio Operational Tracking and Variance
This report shows the cost variance between two dimensions, such as between the Plan and Baseline dimensions.
Descriptions for the fields that are available in this report can be found in the following table.
| Field | Description |
|---|---|
| Investment | The name of the work item, log item, or discussion. |
| Labor | The amount of money that is spent to produce something of value. |
| Non Labor | The total non-labor costs for all non-labor hours in the project. |
| Total | The total costs of all labor and non-labor in the project. |
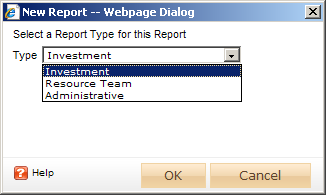
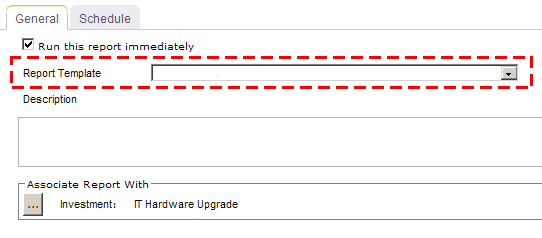
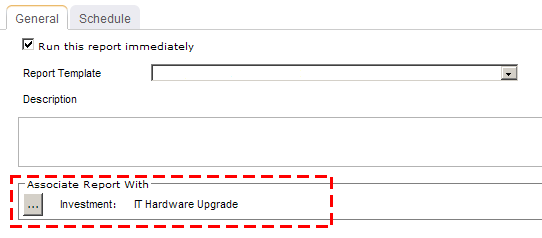
To add a report that uses the Project Portfolio Operational Tracking and Variance report template, open the New Report dialog box from the My Reports tab and then follow the steps below.
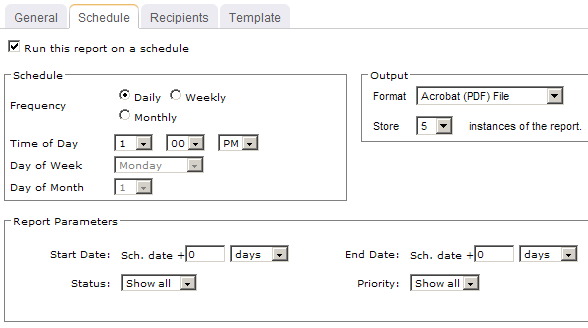
You can view the Project Portfolio Operational Tracking and Variance report directly after adding it by selecting the Run this report immediately option in the New Report dialog box. (Reports can also be run from the My Reports tab in the Tools module or the Reports tabs in the Projects module.) Set the filter options and click ![]() Apply.
Apply.
![]()
Filter options:
| Filter | Description |
|---|---|
| Capex / OpEx | A capital expense is a cost of doing business that is typically associated with expenditures for fixed asset work item that are understood to have a benefit to the organization that exceeds one year> For example, such as buildings and equipment are considered to be capital expenses, whereas rent, office supplies, or utility expenses (such as electricity or Internet access) are not considered to be capital expenses. If an expense is not a capital expense, it is considered to be an operational expense. Filter options: Hide, and Show. |
| Cost Dimension | The dimension for which you want to view data. Reports require two dimensions to be selected so that data for each dimension can be compared, such as comparing the amount of planned work to the amount of actual work. Filter options: Actual, Baseline, None, Plan, Target, or any custom dimension that your organization may have added. |
| Current State | The working state for the work items that will be shown in the report. Filter options: Active, Active and Proposed, All, and Proposed. |
| End Date | The date on which the reporting period ends. Use the calendar picker to select this date. |
| Start Date | The date from which the reporting period begins. Use the calendar picker to select this date. |
| Variance | Variance is the difference between two data points, such as the difference between the amount of planned work and the amount of actual work. Users can choose to show or hide the variance between the dimensions chosen. If the purpose of the report is planning more than operational tracking, some users may choose not to display the variance. Unless an investment is tracking actuals, there may not be any meaningful basis for variance analysis. Filter options: Hide, and Show. |
Copyright © 2003–2011 Serena Software, Inc. All rights reserved.