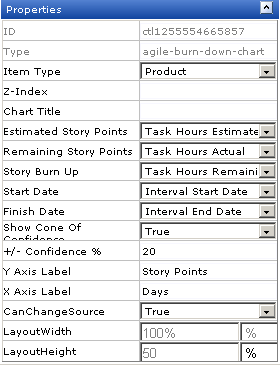
| CanChangeSource |
The CanChangeSource property is used to indicate whether a user can change the source while they are working on the page. Set this property to No to prevent users from changing the source while working on the page.
|
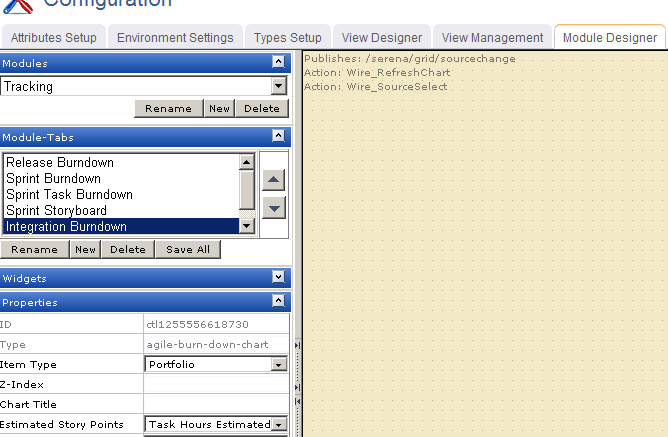
| Chart Title |
The Chart Title property is used to set the title of a chart.
|
| Estimated Story Points |
The Estimated Story Points property is used to specify an estimate of work required to complete a story.
|
| Finish Date |
The Finish Date property is used to specify the end date for an interval.
|
| ID |
Read only. The ID property is used to show the unique ID of the design control.
|
| Item Type |
The work type: portfolio, product, release, team, or sprint. |
| LayoutHeight |
The LayoutHeight property is used to specify the height of a control or widget. LayoutHeight can be specified in pixels or as a percentage of the height of the containing pane.
|
| LayoutWidth |
The Layout Width property is used to specify the width of a control or widget. LayoutWidth can be specified in pixels or as a percentage of the width of the containing pane.
|
| Remaining Story Points |
The Remaining Story Points property is used to specify an estimate of work not yet completed on a story.
|
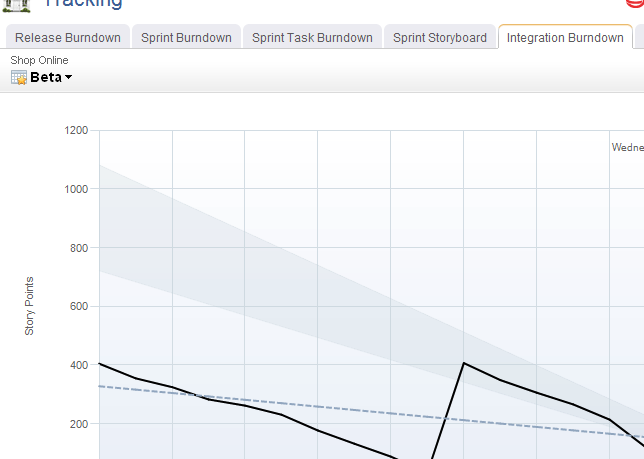
| Show Cone of Confidence |
The Show Cone of Confidence property is used to specify whether to show a set of lines on a burndown chart that indicate whether a team is likely to complete the work for a sprint. The lines show interpolated estimates based on the +/- Confidence % attribute, and are commonly referred to as the "cone of confidence."
|
| Start Date |
The Start Date property is used to specify the start date for an interval.
|
| Story Burn Up |
The Story Burn Up property is used to specify the amount of work completed within a sprint.
|
| Type |
Read only. The Type property is used to show the control type. For example, linklabel, button, hr, and so on.
|
| X-Axis Label |
The X Axis Label property is used to specify a label for the horizontal axis on a chart.
|
| Y-Axis Label |
The Y Axis Label property is used to specify a label for the vertical axis on a chart.
|
| Z-Index |
The Z-Index property is used to set the order by which attributes, controls, and widgets are layered on a page. For example, you can layer a form on top of an image.
|
| +/- Confidence |
The +/- Confidence % property is used to set the range above and below the ideal confidence level that is shown in the cone of confidence in a burndown chart.
|